Partner

Blog

HelpDesk

Consumer Goods-Machine Learning and AI
Consumer Goods

Consumer Goods

Overview of the approach

Business Problem – Identifying growth drivers in existing markets and products markets and recommending actions to replicate them in newer markets and product segments

Setting up Big Data infrastructure to handle large Retail data.

Merging disparate data sources, applying business rule and feature extraction to create analytical data set to be used for hypothesis testing and modelling.

Univariate and multivariate analysis to understand different variables and their relationships.

Exploration and hypothesis testing to understand business trends and provide guidance toward the modelling approach.

Applying different regression techniques to determine the drivers of growth.

Decision Tree analysis to understand the path and actionability towards achieving growth at store clusters.

Provide insights based on exploration and driver analysis.

Recommend guidelines to achieve incremental growth at store clusters.

Hypothesis testing will provide an insight into the business trends and possible predictors of growth.

Some of the key hypothesis are listed below:
  • Increase in product range availability across stores has a positive impact on sales
  • Increase in coverage (no. of sales calls) impacts growth positively
  • Availability of multiple payment and delivery options has a positive impact on sales
  • In-store promotions leads to better brand value and product sales
  • If multiple schemes are in effect, incremental effect of individual schemes goes down
  • Consistent phasing leads to better growth
  • Credit plays a bigger role than schemes for OTC outlets
  • Delay in delivery impacts growth negatively while on time may not impact positively
  • Higher the stocking of the seasonal products in their respective seasons regionally, higher is the sales growth

Few illustrative example of Hypothesis testing are …

Higher product range availability has a positive impact on sales

  • The number of product ranges available is plotted against the sales observed in the same region – category - class.
  • Positive correlation between the no. of product ranges available and the corresponding sales is observed.
  • Therefore, product range availability has a positive effect on sales.
Higher product range availability has a positive impact on sales

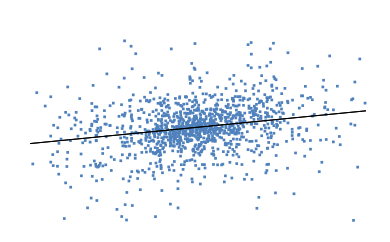
Increase in number of visits by a representative has a positive effect on sales.

  • Scatter plot is created for growth in sales to number of calls by reps.
  • The trend line fitting through the plot is found to have a positive slope.
  • Therefore, increase in number of visits by a rep has a positive effect on sales.
Increase in number of visits by a representative has a positive effect on sales

Identifying drivers for sales growth.

Decompose the overall sustainable growth at store clusters into their primary components to identify their contribution:

  • Volume growth - Determining the value share in sales due to growth in unit sales of existing SKUs over time.
  • Range growth - Determining percentage increase in sales due to new sustainable SKUs that are being sold over time.
  • Mix growth - Determining the sales increment due to a change in preference towards higher priced products.
 

Multiple statistical techniques will be used to determine the important drivers that are contributing to the growth of each of the components.

Recommend actionable steps for every store cluster, by identifying which of the important drivers extracted above have to be addressed for that cluster.
Combination of growth driving factors would help in identifying opportunities for growth replication.

Mix growth
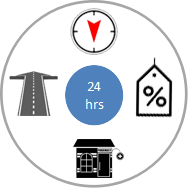
  • Region: South
  • Outlet category: Chemist
  • Operational hours: 24
  • Discounts: Yes
  • Store proximity: 5 km
  • Mix growth: 17%

Range growth
  • Region: North
  • Outlet category: General store
  • Operational hours: 12
  • Sales promotions: High
  • Payment types: Credit card
  • Range growth: 21%

Overall growth is decomposed into Volume growth, Range growth & Mix growth

Total units sold: 90

Total price: 50*1.2 + 40*0.9 = 96

Total units sold: 155

Total price: 60*1.3 + 50*1 + 45*1.4 = 191

Range Growth

Total units sold (New SKU) * Unit price of new SKU

45*1.4 = 63

Growth %: 63/96 = 65.6%

Volume Growth

[Total units sold (C.M.) - Total existing units sold (P.M.)] * (Total sales [P.M.] / Total units sold [P.M.]) for existing SKUs

(110-90) * (96/90) = 21.33

Growth %: 21.33/96 = 22.2%

Inflation Growth / Price change effect

ΣSKU (Total units sold (C.M.) * (Price C.M. – Price P.M.) for existing SKUs

60(1.3-1.2) + 50(1-0.9) = 6 + 5 = 11

Growth %: 11/96 = 11.4%

For ease of calculation, inflation/price change growth to be considered in Volume growth.

Mix Growth

ΣSKU (Total units sold (C.M.) *Price (P.M)) - [Total units sold (C.M.)* Total sales (P.M.) / Total units sold (P.M.)] for existing SKUs

60*1.2 + 50*0.9 – 110*96/90 = 117 – 117.33 = -0.33

Growth %: (-0.33)/96 = (-0.34)%

  • Total Growth: 95/96 = 98.95%
  • Range Growth: 65.6%
  • Volume growth: 22.2%+11.4% = 33.6%
  • Mix Growth: (-0.34)%

Product attributes.

  • Product range availability across outlets.
  • No. of SKU variants available.
  • Product/SKU cannibalization.
  • Dynamic Pricing based on competing products

Consumer attributes.

  • Loyalty program availed by customers.
  • Premium products availability for High income group locations.

Marketing attributes.

  • No. of visits by the sales force.
  • In-store promotions.
  • Credit facility.
  • Discounts.
  • Other schemes and promotions.

Supply chain attributes.

  • Inventory stock.
  • Out of stock frequency.
  • Time phasing.
  • Product lead time.
  • Seasonal product ranging by areas.

Outlet attributes.

  • Outlet types, categories and class.
  • # of outlets with multiple payment methods.
  • # of outlets with delivery options.
  • Operational hours.
  • Density of stores.
  • New/old outlets.

Exploratory analysis will be done to understand to understand different variables and their interconnections.

Univariate analysis

Univariate non-graphical: to help identify any outliers and better understand the distribution of the sample by primarily utilizing descriptive statistics.

  • Frequency reports
  • Measures of spread
  • Central tendency measures
 

Visualization of the descriptive statistics from the non-graphical techniques, including but not limited to:

  • Histograms
  • Box-plots
  • Quantile normal plot (looks at the observed and expected values)
  • Stem and leaf plots

Multivariate Analysis

To understand the relationship between two or more of the variables contained in the databases through statistical techniques, including but not limited to:

  • Cross-tabs
  • Correlation
  • Covariance
  • ANOVA