Partner

Blog

HelpDesk

Hospitality-Machine Learning and AI
Hospitality

Hospitality

Hotel rooms from different localities to be priced according to the evolving status of available inventory coupled with demand factors.

Hotel

Hotel

Rooms priced

Rooms priced according to the remaining inventory status of the hotel

  • Rooms priced according to Inventory remaining status 1
  • Rooms priced according to Inventory remaining status 2
  • Rooms priced according to Inventory remaining status 3

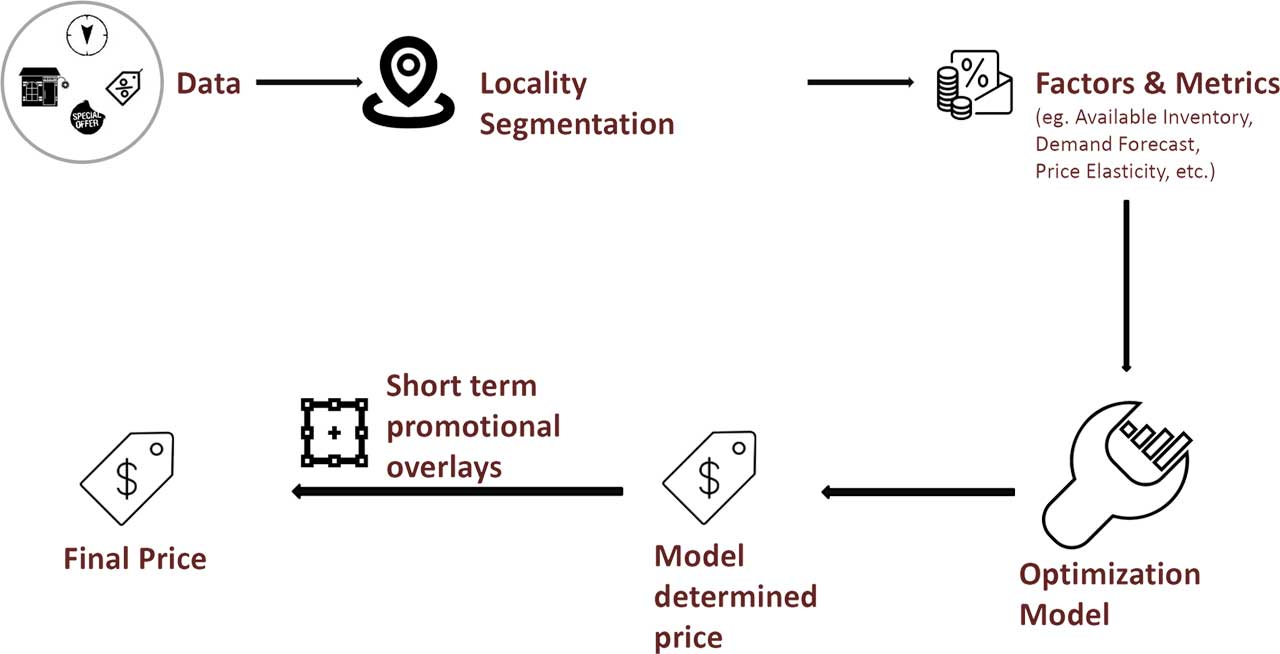
Overall process flow

Overall process flow

Overall process flow - Detailed

DATA SOURCES

Information on Hotels

Information on Hotels

Competitor Data

Competitor Data

Transaction Data

Transaction Data

Clickstream Data

Clickstream Data

STEP 1:

TECHNIQUES USED

Decision Trees

Decision Trees

Time Series Analysis

Time Series Analysis

Regression

Regression

Hierarchical Clustering

Hierarchical Clustering

STEP 2:

SEGMENTS & FACTORS DERIVED

Locality segments

Locality segments

Demand Forecast

Demand Forecast

Price elasticity of Demand

Price elasticity of Demand

Nominal Price

Nominal Price

STEP 3:

OPTIMIZATION MODELLING

Maximize Revenue

Linear Programming with objective function: Maximize Revenue

STEP 4:

OUTCOME

Discounts offered

Discounts offered

Rounding off the numbers

Rounding off the numbers

Recommended Price

RECOMMENDED PRICE

DATA SOURCES

Information on Hotels

Information on Hotels

Competitor Data

Competitor Data

Transaction Data

Transaction Data

Clickstream Data

Clickstream Data

STEP 1:

TECHNIQUES USED

Decision Trees

Decision Trees

Time Series Analysis

Time Series Analysis

Regression

Regression

Hierarchical Clustering

Hierarchical Clustering

STEP 2:

SEGMENTS & FACTORS DERIVED

Locality segments

Locality segments

Demand Forecast

Demand Forecast

Price elasticity of Demand

Price elasticity of Demand

Nominal Price

Nominal Price

STEP 3:

OPTIMIZATION MODELLING

Maximize Revenue

Linear Programming with objective function: Maximize Revenue

STEP 4:

OUTCOME

Discounts offered

Discounts offered

Rounding off the numbers

Rounding off the numbers

RECOMMENDED PRICE

Approach for location segmentation

location segmentation

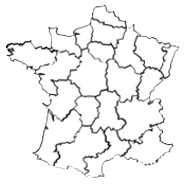
Hotels across a city are grouped together using the distances between them using Hierarchical Clustering, thereby creating clusters.

location segmentation

Name of the segment according to the nearby landmark place ā€“ either tourist or business destination.
location segmentation

Geography of the city is divided into multiple demand segments.
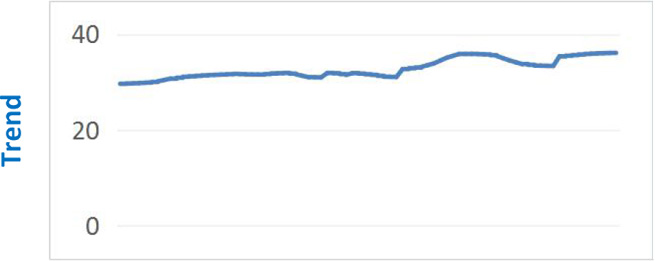
Demand is forecasted for each location segment

Decomposed Elements

Macroeconomic factors

Common Examples

Macroeconomic factors:

  • Population growth
  • Economic growth
  • Investment in travel & tourism

Decomposed Elements

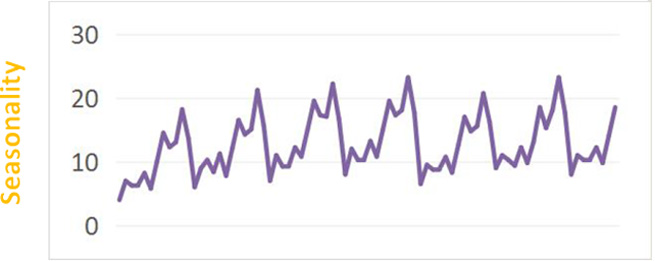
Regularly occurring expected events

Common Examples

Regularly occurring expected events:

  • Festivals and annual events
  • Summer vacation for schools
  • Weekend effect

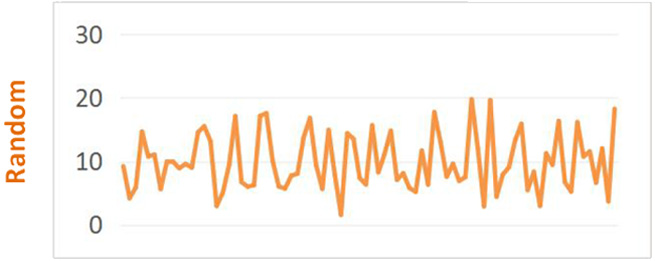
Decomposed Elements

Unexpected demand influencers

Common Examples

Unexpected demand influencers:

  • Outbreak of an epidemic
  • Natural Calamities

Demand is forecasted for each location segment

Forecasting can be done for the individual components from the decomposed time series and overall using following techniques:
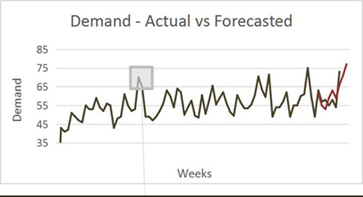
  • ARIMA
  • Exponential Smoothing Technique
  • Speed Curve Forecasting
Demand - Actual vs Forecasted

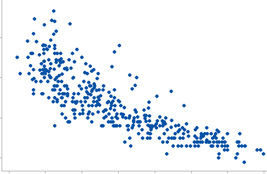
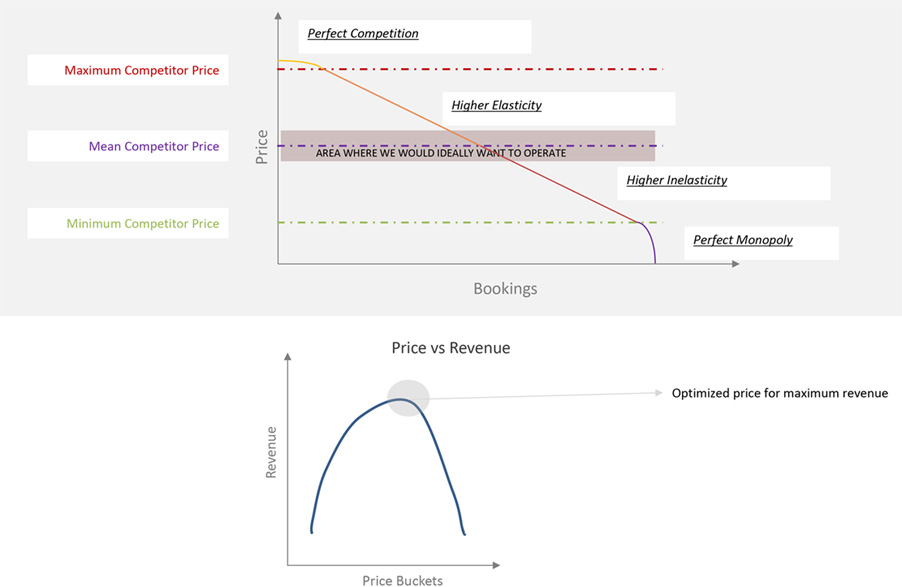
Price Elasticity of Demand is calculated for each location segment

Price Elasticity of Demand is calculated for each location segment

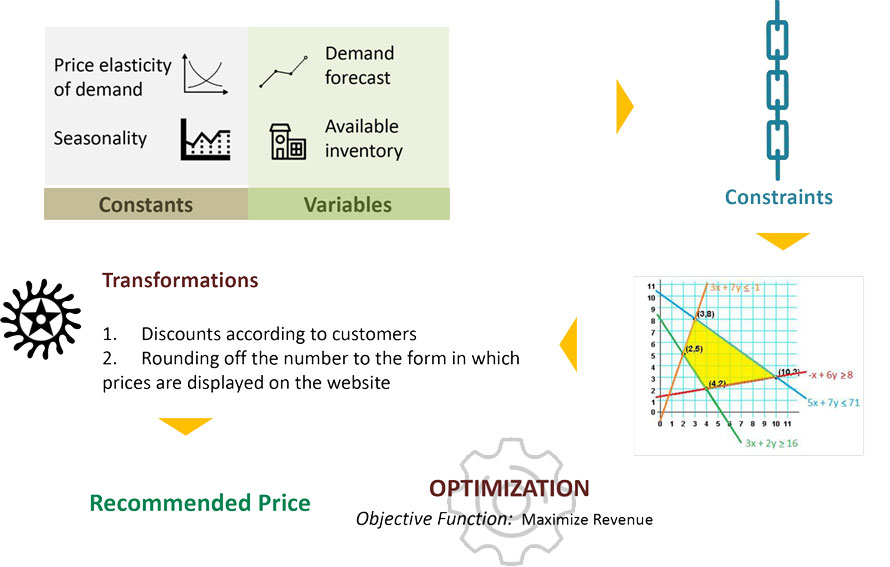
Optimization Approach

Optimization Model

Objective Function: Maximize Revenue

Allocation of price to each room according to available inventory and other factors
CALCULATION OF ELEMENTS

Expected Demand

Expected Demand

Nominal Price

Nominal Price

Price Elasticity of Demand

Price Elasticity of Demand

Optimization Approach - Detailed

Optimization Approach - Detailed

Optimization Approach ā€“ Mathematical Formulation

Objective function:

Maximize P*X across various instances

Where:

P: Price of the room

Constraints:

Price >= Minimum Operational Cost of the room (alternatively, Minimum Competitor Price in the locality)

Price <= Maximum Competitor Price in the locality

Expected number of rooms booked at price PL<= Inventory remaining at the instance

Inventory remaining <= Overall Capacity for the hotel

Constraints
  • e: Price elasticity of demand
  • X: Expected number of rooms booked at price PL
  • d: Expected number of rooms booked at price Pnominal
  • PL : Price allocated to rooms
  • Pnominal : Nominal price of the rooms given demand d (based on historical prices)

For every scenario of remaining inventory, optimal ā€˜Pā€™ will get calculated